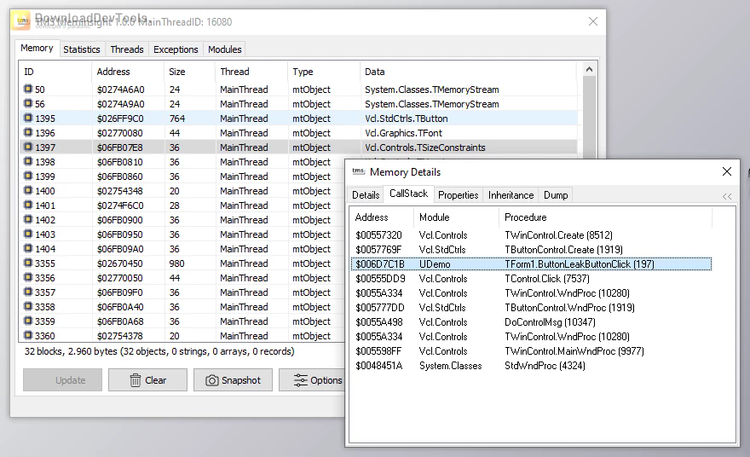

TMS MemInsight offers a comprehensive suite of debugging tools tailored for Delphi projects, facilitating in-depth analysis of run-time memory allocation, exception call stack logging, thread inspection, and more. This versatile toolset comprises modules for memory profiling, thread visualization, module examination, and an advanced exception handler. Seamlessly integrating into Delphi projects, TMS MemInsight can be utilized through its user-friendly graphical interface or API.
TMS MemInsight's key features include its ability to identify and analyze objects, strings, arrays, and records within the runtime memory. It extends support to packages and enables the profiling of multiple threads concurrently. With built-in call stack retrieval functionality and utilization of standard MAP files, developers can efficiently trace and debug application exceptions. Notably, TMS MemInsight operates independently of compiler switches, ensuring ease of integration and usage.
Moreover, provides an integrated GUI for effortless monitoring and debugging tasks, requiring minimal special requirements from developers. Its support for wait chain traversal and detection of thread deadlocks further enhances its utility in diagnosing complex runtime issues. Additionally, the tool offers the detection of prematurely freed memory, empowering developers with insights to optimize memory management and enhance application stability.
